Overlay Mapping
In the sixties, the landscape architect Ian L. Mc Harg was studying how to design new roadway damaging as less as possible natural heritage and biodiversity. To do that, he developed an eligibility analysis through a technique he called "overlay mapping". The technique consists of the overlapping of different thematic maps.
The first step is to identify the values (historical, hydrogeological, panoramic, residential, institutional, etc.) of the affected area. For each value Mc Harg drew a map, on a transparent paper, using shades of grey that represent the degree of importance of every area related to its social/economic/environmental cost. In a passage describing the process he and his colleagues used to determine the least destructive route for a new roadway, McHarg (1971) wrote:
"let us map physiographic factors so that the darker the tone, the greater the cost. Let us similarly map social values so that the darker the tone, the higher the value. Let us make the maps transparent. When these are superimposed, the least-social-cost areas are revealed by the lightest tone" (p. 34).
Overlapping the map you obtain a composition that include all the social/economic/environmental costs and that permit to see where phenomena are concentrated in an area.
Mc Harg achieved to see there the rout of the new roadway will have caused less damages (lighter grey = minor cost) and what values it will have destroyed.
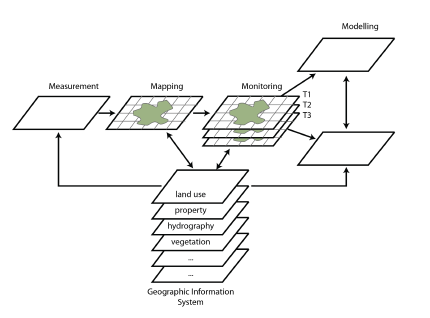
Mc Harg's methodology permits to measure, to map, to monitor and to model areas.

Image 1: McHarg's Map Layering Concept and its four M: Measurement, Mapping, Monitoring and Modeling. From this scheme, GIS permit unlimited combinations of mappable features, arbitrarily "weighed" (lighter or darker grey) and electronically combined.
"Storing digital data in multiple "layers" is not unique to GIS, of course; computer-aided design (CAD) packages and even spreadsheets also support layering. What's unique about GIS, and important about map overlay, is its ability to generate a new data layer as a product of existing layers"[1].
To give an example, we can mention the interesting Italian experience done in collaboration between ISRPA (Istituto Superiore per la Protezione e la Ricerca Ambientale, body for Protection and Environmental Research) and ISCR (Istituto Superiore per la Conservazione ed il Restauro, body for conservation and restoration). Using GIS systems it was possible to elaborate a preliminary estimate of the cultural goods exposed to water-risks and landslide. ISPRA and ISCR carried out a GIS analysis of different informative layers: landslide risks (source: Progetto Inventario Fenomeni Franosi in Italia); water-risk zones (source: PAI); cultural goods and cultural goods' vulnerability (source: Carta del Rischio) (Spizzichino et al., 2013).
[1] The concept of Overlay Mapping
