Structure of the GIS tool
It is necessary to design the monitoring plan and, according to this, the platform. What are the goals of the platform? Who will use the platform? It is fundamental to clarify the purposes and the structure of the platform before searching for data and building the web GIS application.
STEP 1. DATA
The first step is to understand which data are already available and which we need to collect to be coherent with the presented needs and intentions. New specific data can be obtained through surveys or through interpolations of available data.
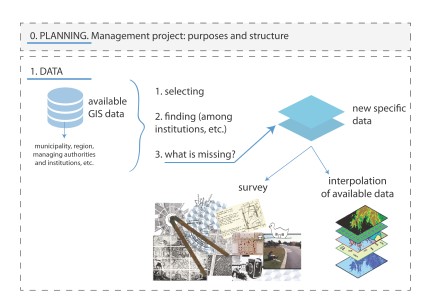
Step n. 1 - DATA
STEP 2. DATABASE
Once we have available data and new specific data collected to implement our strategy, we put this data in a GIS cloud system because we want to create something based on GIS but also something to be used by people without specific competences or software.
After the upload of data, we need to verify if all the data are actually useful (and in this case to delate some layer) or if something is missing (and in this case go back to step n.1).
Data should be update over time: who will upload data? how often is data updated? According to deliverable DT221 e DT222 it is not possible to generally establish how often data should be update. However, rules for periodicity must be specified. These rules can be divided into:
- Strict periodicity – short-term or long-term fixed cycles (it can be linked to local strategy or development program)
- Ad hoc – based on needs (e.g. new planned activity in area) or milestones (e.g. before and after intervention)
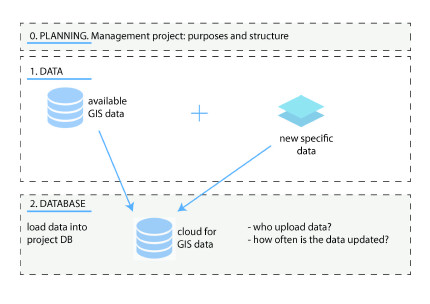
Step n. 2: DATABASE
STEP 3. WEB GIS APPLICATION
Web applications based on GIS data make possible the use and the interface of this data to a general audience without specific competencies or software. Once upload data in the cloud for GIS data, a web GIS application will show them, publicly or inside PA, according to the purposes of the platform.
Every authorised user, simply accessing though his PC (or Smartphone o tablet) could use the platform. The web application is composed by:
- a thematic map
- a legenda to understand the map, on the left, composed by the layers inside the web gis application. Layers can be turn off or on
- some data for every object inserted in the map, shown when the user click on the object
- a toolbar: zoom in, zoom out, save the map, measure, etc., or other tools according to the purposes of the platform
Objects shown in the map can be polygons, polylines or points.
The web GIS application can be obtain though different commercial solution, for example ESRI technology or GIS CLOUD.
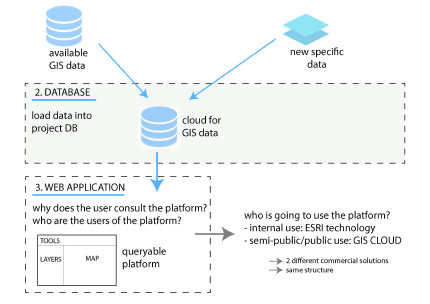
STEP 3 - Structure of the web application
For every user of the web GIS application should be set the role, the visible information and the possible actions. For example:
| USER | ROLE | VISIBLE INFORMATION | POSSIBLE ACTIONS |
| Common citizen | Basic user | General information and thematic layer 1, 2 and 3 | Consult |
| Private technicians (architects and engineers) | Editor | General information and thematic layer 1-5 | Consult and add information |
| PA technicians | Administrator | All | Consult and add information |
| ... |
4. CROWDSOURCING
Web GIS technologies like GIS CLOUD give the possibility to involve citizens (or institutions, associations, etc.) in the data collection. Users can fill a form and - once PA technicians validated the data - reports are shown on the map. Crowdsourcing solution is to evaluate as necessary for the monitoring project.
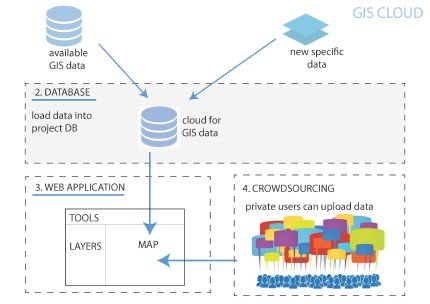
Step 4 - crowdsourcing
If a crowdsourcing solution is chosen, it is to evaluate if data should periodically be export from the web application and saved in the PA database of the available GIS data.
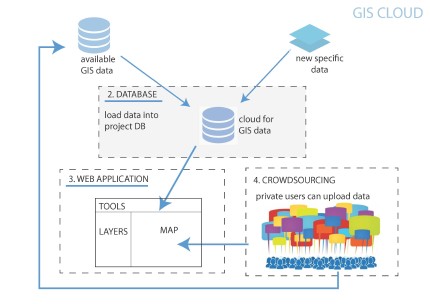
from crowdsourcing to GIS database
